
Making Search Console’s AI Report Useful: Yes, It’s Possible (Really)
Key takeaways:
- Search Console’s AI report is still limited, but when you cross-reference it with logs and conversion data, it reveals business opportunities and risks.
- Assess AI visibility by site section, then cross-reference it with conversions and revenue to identify your priority pages.
- Use SERP data to measure exposure to AI Overviews, and logs to analyze AI bot activity.
- Combine AI visibility, organic traffic dependence, and business value to estimate how exposed your pages are. Assess their resilience separately.
- The goal isn’t to produce a score for the sake of it, but to prioritize SEO/AEO actions based on their potential business impact.
The generative AI section of GSC, available for a few months now, has generated a lot of digital ink. Far from sparking widespread enthusiasm, the report was met with a well-deserved shrug, since it doesn’t show much beyond an impressions curve and impression counts per page. Pretty thin. However, behind what looks like a dud from Google, you can extract a lot of information from it, as long as you cross-reference it with other internal data. Here’s how to calculate your content’s exposure to AI, its resilience, the opportunities worth grabbing, all through the lens of the real value of your pages.

Good, but not great
I already covered the importance of crawl frequency for the various AI bots, and how you can infer the impact of your work in AI assistants from it (see here). That was a start.
Consultant Harry Clarkson-Bennett shared a method for making Google Search Console’s (lame) generative AI report “brilliant” (see here), and his only mistake is treating log analysis as optional, when it’s still one of the most reliable sources for understanding AI crawler behavior in detail.
The goal is to correlate the different signals each tool provides and connect them to understand which corners of a site hold the most value for visitors. SEOs generally know this kind of calculation well, but since we have neither clicks nor search queries here, you’ll have to get creative and pay attention to the details to figure out where your site stands.
Why spend your time on this kind of calculation, you ask? To find out:
- Whether your AI search efforts are generating $$$
- Whether your converting pages are threatened by AI Overviews
- Whether you need to convince a client or your boss to invest in AEO/GEO
Here’s how it works:
The calculation, in plain terms
For each major section of your site (/blog/, /courses/, /pricing/…), you assign four scores out of 100:
- Visibility measures your presence in AI answers.
- Demand counts visits from ChatGPT-User, Claude-User, or Perplexity-User in your logs (“User” indicates user-triggered actions).
- Dependence is the share of the section’s traffic that comes from organic search.
- Value is the share of your revenue or leads that the section generates.
If you have SERP data (DataForSEO, for example), add a fifth score, organic exposure: the share of the section’s queries that trigger an AI Overview.
Then multiply these scores together and take the root matching the number of scores (in Sheets, =GEOMEAN(A2:E2) does all the work).
For example: your blog scores 90 for visibility, 85 for demand, 80 for organic exposure, and 70 for dependence, but only 10 for value, for an exposure score of 48. Your course pages score 80, 70, 30, 60, and 90, for a score of 57.
Last step: resilience. This time, it’s a simple average of four numbers: the share of branded searches, the share of direct traffic, the share of returning visitors, and a score for how well the content can “defend itself.”
Step by step
Ready? Let’s go:
1) Export the GSC data
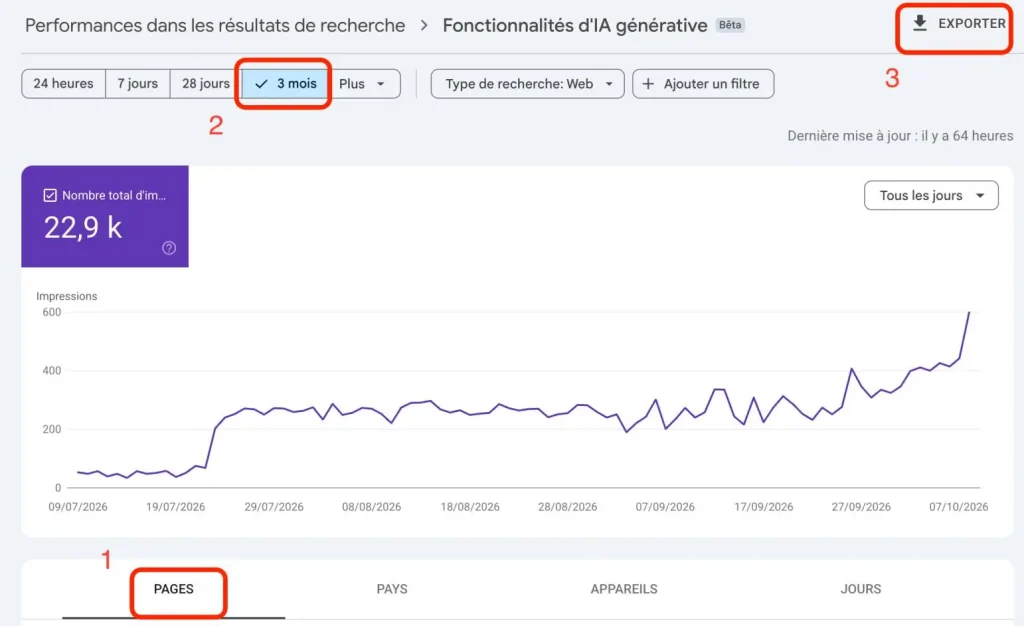
Go to the generative AI report (under Performance) in Search Console for the whole site, then export the last three months of data by page.
2) Find where most of your AI visibility sits
It’s generally best to group by subfolder (/courses, /blog, /news) when assessing visibility, which simply means figuring out which URLs and categories account for the largest share of AI impressions, based on the GSC export.
Depending on the size of the site, Search Console’s sampling, capped at 1,000 URLs, may not fully represent AI activity, but it’s usually enough to get a sense of things. For a comprehensive report, go back to step 1 and select properties for the site’s subfolders (which you can add just like a domain), increasing the number of URLs covered in GSC reports.
3) Add conversion data
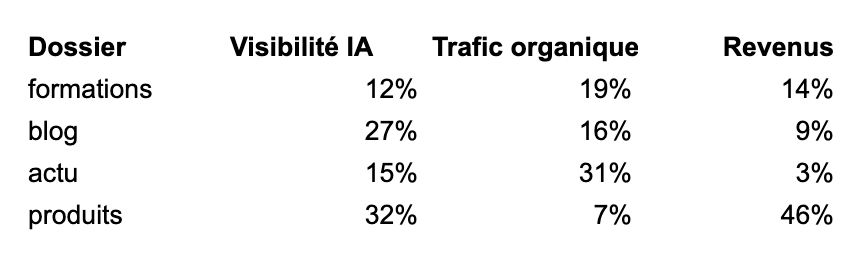
Now add your conversion data, meaning revenue, sign-ups, leads, etc., and their percentage for each subfolder/URL, so you can compare them with AI visibility.
High AI visibility plus a large share of revenue = a red flag.
4) Organic AI exposure
Take the top 100 or 1,000 GSC queries for each folder or section, then use a keyword research tool, ideally with an API to handle large volumes, like Ahrefs or DataForSEO, to find every query that triggers an AI Overview.
Once you have them, all that’s left is to calculate the percentage of AIOs per folder/URL to determine AI exposure in the search results.
5) Pull AI bot activity
Time to use your logs! The details you extract on AI bot activity let you see, up close, what kinds of actions LLMs are performing.
While the bots behind AIOs, AI Mode, and Gemini aren’t identifiable beyond Googlebot (Googlebot-Other was rumored for a while to be THE Gemini bot, which was later denied), you can see what ChatGPT is doing, among others, through its user agents OAI-SearchBot, ChatGPT-User, and GPTBot.
This shows you crawl frequency, what type of content gets crawled, by which bots, and at what volume, giving you an extra signal that adds weight to your GSC findings.
6) Traffic dependence
Here you simply need to understand what percentage of a folder’s/URL’s traffic comes from organic search, to determine the level of urgency. If organic traffic accounts for only 15% of a URL’s total, that page is safer than one where organic makes up 90% of traffic.
7) The formula
Now it’s time to put it all together:
(AI visibility × organic exposure × organic traffic dependence × conversion value)^(1/4) = business exposure to AI
You get a score out of 100 that shows how severe this exposure is per folder or URL, and its impact on the business.
8) Resilience
This is about assessing our ability to withstand the AI onslaught if the number of AI Overviews grows. Take the percentage of branded traffic, direct traffic, and returning traffic, plus a 0 to 100 content defense score, meaning how hard it is to copy or replace the original content (you set this score yourself).
The calculation: (branded traffic + direct + returning + content defense) / 4
The higher the score, the better protected that section/URL is.
In summary
Google’s generative AI report can be useful and reveal a number of important insights. Correlated with logs and conversion data, it becomes a real basis for investing in AI and a way to see your efforts pay off.
Imperfect, sure, but probably one of the most complete models available right now. Once again, I recommend reading Clarkson-Bennett’s newsletter to get all the nuances and more detail.